
Metrics 📊
The output sCT will be compared to CT using image similarity metrics (preliminary test, validation and test phases), geometric fidelity (validation and test phases) and dose evaluation metrics (test phase only due to the heavy computational costs) to best reflect its clinical performance. For all analyses, to ensure maximal anatomical similarity between the sCT and the ground truth CT, the latter will be deformed by deformable image registration using an open-source deformable image registration algorithm (Elastix toolbox). During validation only image similarity and geometric fidelity will be ranked, while during testing image similarity, geometric fidelity and dose metrics from photon and dose metrics from proton plans are equally weighted. Metrics are detailed below and provided at https://github.com/SynthRAD2025/metrics.
Image similarity
Image similarity will be evaluated by mean absolute error (MAE), peak-signal-to-noise ratio (PSNR), and (structural similarity index) SSIM between sCT and deformed CT.
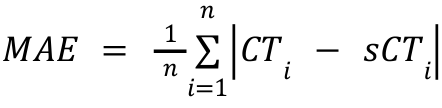
- Mean absolute error (MAE) in the dilated body mask, defined as
 ,
,
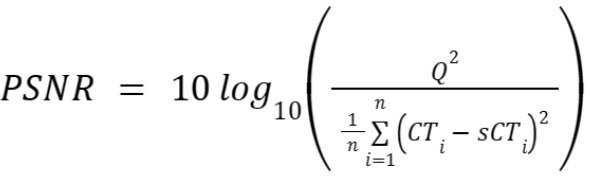
Where n is the number of voxels in the dilated body mask. - Peak signal-to-noise ratio (PSNR) in the dilated body mask,
defined as
 ,
,
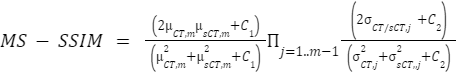
where n is the number of voxels in the dilated body mask, and Q is the typical range of voxel intensities in the CTs (4000 HU). - Multi-Scale Structural similarity index (MS-SSIM) on the mask as
defined by:
 ,
,
where μ_(s)CT is the mean pixel value of the (s)CT, δ_(s)CT is the variance of the (s)CT, and δ is the covariance of CT and sCT. C1=(0.01Q)^2 and C2=(0.03Q)^2 are two variables to stabilize the division with weak denominators, with Q being the typical range of voxel intensities in the CTs (4000 HU). The MS-SSIM evaluates the SSIM at multiple resolution levels (by default 5), reducing the resolution by a downsampling factor of 2 at every level. Using this metric, the global image quality (overall similarity and contrast) and the local image quality (tumor and organ-at-risk similarity) can be verified.
Geometric consistency
The geometric consistency between deformed CT and sCT will be evaluated by analysing the segmentation of anatomical structures. The images will be segmented using deep learning-based image segmentation solutions (TotalSegmentator and nnUnet). The geometric consistency will be evaluated using the: multiclass-DICE coefficient (mDice) and the 95th percentile Hausdorff distance (HD95), averaging over all the structures.
- The multiclass-DICE (mDice) coefficient is measured as:
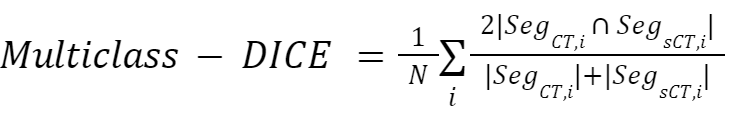
where N is the number of classes, and Seg_X,i is the segmention of the i-th class in image X.
- The Haussdorf distance (HD) is defined as:

where SegX,i and SegY,i are the contours of the i-th class in the images X and Y, respectively, and sup is the supremum operator. The HD95 is similar to the Hausdorff distance, but is obtained by computing the 95th percentile of the distances between the boundaries rather than the maximum. This metric is more robust against outlier segmentations. TotalSegmentator will be used to provide segmentations in the abdomen and thorax region using the liver, kidney, lung, ribs, sternum, vertebrae, myocardium, cardiac ventricles, and cardiac atria structures. A custom-trained nnUnet using the pre-contrast CT will be used to provide segmentations in the head-and-neck regions using the brainstem, spinal cord, skull, vertebrae, mandible, submandibles, parotid, thyroid, esophagus, trachea, and oral cavity structures.
Dose evaluation
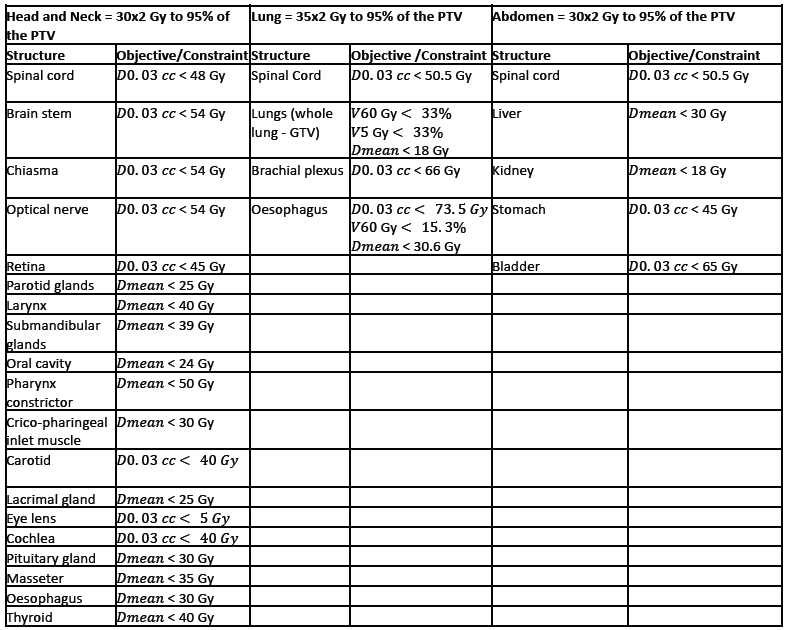
This will be performed globally and locally by comparing photon and proton therapy dose calculations between reference deformed CT and sCT. Clinically, the most relevant question would be how a dose plan optimized on the reference CT (the 'ground truth' where patients are currently treated) would perform on the sCT (the image at the disposal in the new clinical workflow). Dose calculations will be performed with matRad, an open-source treatment planning system where photon and proton intensity-modulated treatment plans will be optimized on the deformed CT. Dose prescriptions and plans will be chosen irrespective of the original clinical goal for each anatomy, with the center of the planning target volume (PTV) chosen as the isocenter. Specifically, we will plan to prescribe the target (PTV) a dose of 30x2.0 Gy for the head and neck, 35x2.0 Gy for the lung, and 30x2.0 Gy for the abdomen cases at the 95% isodose level for both photons and protons. For simplicity, proton plans will be planned using the same PTV approach as photons, without robust optimization. Dose delivery will be simulated via ten beams of 6MV for photons using the generic Linac model and 2-3 beams for proton plans using the generic proton system modeled in matRad. The number of beams may be optimized on a patient basis to comply with the dose prescription and limit the dose to the organs at risk following the international guidelines: for the head and neck [Deasy et al., 2010, Beetz et al, 2013 and Marks et al, 2010], lung [Puckett et al., 2023] and the abdomen [Marks et al, 2010]. To further reduce the dose to the healthy tissues and ensure plan uniformity between patients, we will use the same objective functions and constraints available in matRad per treatment site, as reported in the table below. OARs dose limits will be handled as hard constraints whenever possible but might be turned into objectives on a patient-specific basis.
For each sCT, the plan will be recalculated without replanning to avoid possible differences due to plan optimization.
Dose constraints and planning objectives used in matRaD for the
head-and-neck, lung, and abdomen cases:
The following metrics are considered for the dosimetric evaluation:
- Mean absolute dose differences relative to the prescribed dose
 as defined by
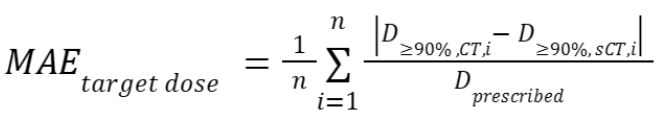 ,
,
with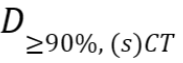 the dose
distribution in the (s)CT within the regions that receive at least
90% of
the dose
distribution in the (s)CT within the regions that receive at least
90% of  in the CT, and n the
number of voxels within this region.
in the CT, and n the
number of voxels within this region. - A dose-volume histogram (DVH) provides information on the
delivered dose to a volume of specific structures. Small differences
in DVH parameters between the CT and the sCT indicate a good
radiotherapy treatment based on the sCT. We consider four DVH
parameters: near-minimum dose
 , which is the dose
that at least 98% of the target volume received,
, which is the dose
that at least 98% of the target volume received,  , which is the target
volume that received at least 95% of the prescribed dose,
near-maximum dose
, which is the target
volume that received at least 95% of the prescribed dose,
near-maximum dose  , which is the dose 2%
of the volume of a specific organ-at-risk (OAR) received, and
, which is the dose 2%
of the volume of a specific organ-at-risk (OAR) received, and  , which is the mean
dose a specific OAR received. Specifically, using the near-minimum
and near-maximum was suggested by ICRU83
(https://www.fnkv.cz/soubory/216/icru-83.pdf).
For the evaluation, we recognize three organs at risk closest to the
target (PTV) per region. To obtain one metric for all DVH
parameters, we sum the relative absolute differences of the
parameters mentioned above between the deformed CT and sCT. The final metric
is defined as
, which is the mean
dose a specific OAR received. Specifically, using the near-minimum
and near-maximum was suggested by ICRU83
(https://www.fnkv.cz/soubory/216/icru-83.pdf).
For the evaluation, we recognize three organs at risk closest to the
target (PTV) per region. To obtain one metric for all DVH
parameters, we sum the relative absolute differences of the
parameters mentioned above between the deformed CT and sCT. The final metric
is defined as
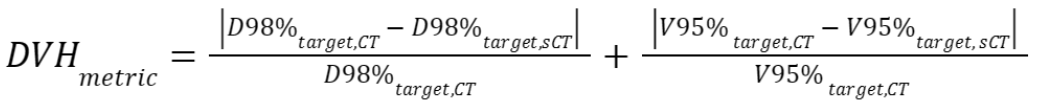
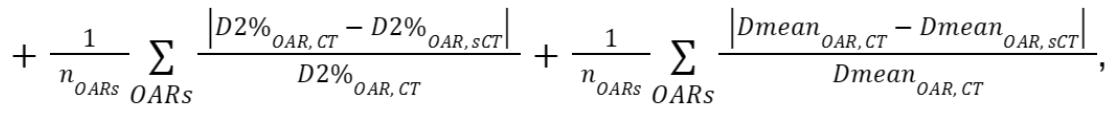
where is the number of OARs
and set to 3.
is the number of OARs
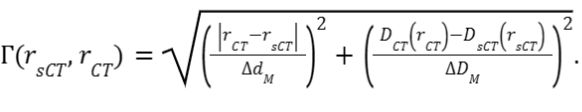
and set to 3. - Gamma index: The Gamma pass rates will be calculated for sCT
based doses using the CT doses as a reference. The calculation is
performed in 3D, according to
Low et al., 1998. The passing criteria are the
dose-difference criterion
 = 2% and the
distance-to-agreement criterion
= 2% and the
distance-to-agreement criterion  = 2mm. The gamma index
at each position vector r in the sCT is:
= 2mm. The gamma index
at each position vector r in the sCT is: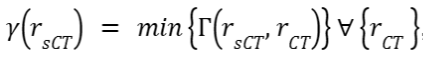 , where
  indicates a position
vector in the CT and
indicates a position
vector in the CT and
Gamma pass rates will be calculated within the regions that receive a dose higher than 10% of , as suggested by
Ezzel et
al., 2009.
, as suggested by
Ezzel et
al., 2009.
Ranking📈
A water bulk-assigned baseline sCT model will be used as a submission threshold. The water sCTs will be obtained by assigning 0 HU to voxels (value of water by definition) within the dilated body contour mask and -1000 HU outside the mask (air).
Teams will not be considered in the ranking if their method does not outperform the water baseline in at least one of the three individual image similarity metrics.
To rank the submissions by the participants, the average metric value over all the patients is computed, yielding average MAE, PSNR, MS-SSIM; mDice, HD95; photon MAE_target dose, photon DVH_metric, photon Gamma; proton MAE_target dose, proton DVH_metric, proton Gamma. Then, this average score is ranked per metric against all other submissions. Note that in case of outliers, we will consider aggregating based on the median instead of the average. The final rank for a submission is obtained by computing the average/median rank per metric from the list above, ranging from 1 (best submission) to n (worst submission). This RankThenMean approach is selected for SynthRAD2025, as opposed to MeanThenRank for SynthRAD2023, since the 2023 challenge report demonstrated that RankThenMean was stable without the need for arbitrary normalization of metrics (see https://arxiv.org/pdf/2403.08447 sections 2.6 and 4.5)
We will incorporate an automatic evaluation pipeline on the hosting site, offering dose evaluation for all the test submissions, along with a leaderboard.
Validation phase: The first ranking phase includes only the image metrics (MAE, PSNR, MS-SSIM) and geometry consistency (mDice, HD95) on the validation set. The rank in the validation phase will be calculated using the RankThenMean procedure described above.
Test phase: The second ranking phase includes the image metrics (MAE, PSNR, MS-SSIM), geometric consistency (mDice, HD95) & the dose evaluation (photon MAE_target dose, photon DVH_metric, photon Gamma and proton MAE_target dose, proton DVH_metric, proton Gamma) on the test set. The ranking among all 11 metrics will be determined according to the RankThenMean procedure described above. In case of a tie, the team with the best dosimetric accuracy will rank higher than teams with an equal average rank. The proton dose accuracy will be ultimately decisive in case a tie will result from photon dose metrics.